
Environmental memory gained from exposure to extreme pCO2 variability promotes coral cellular acid–base homeostasis
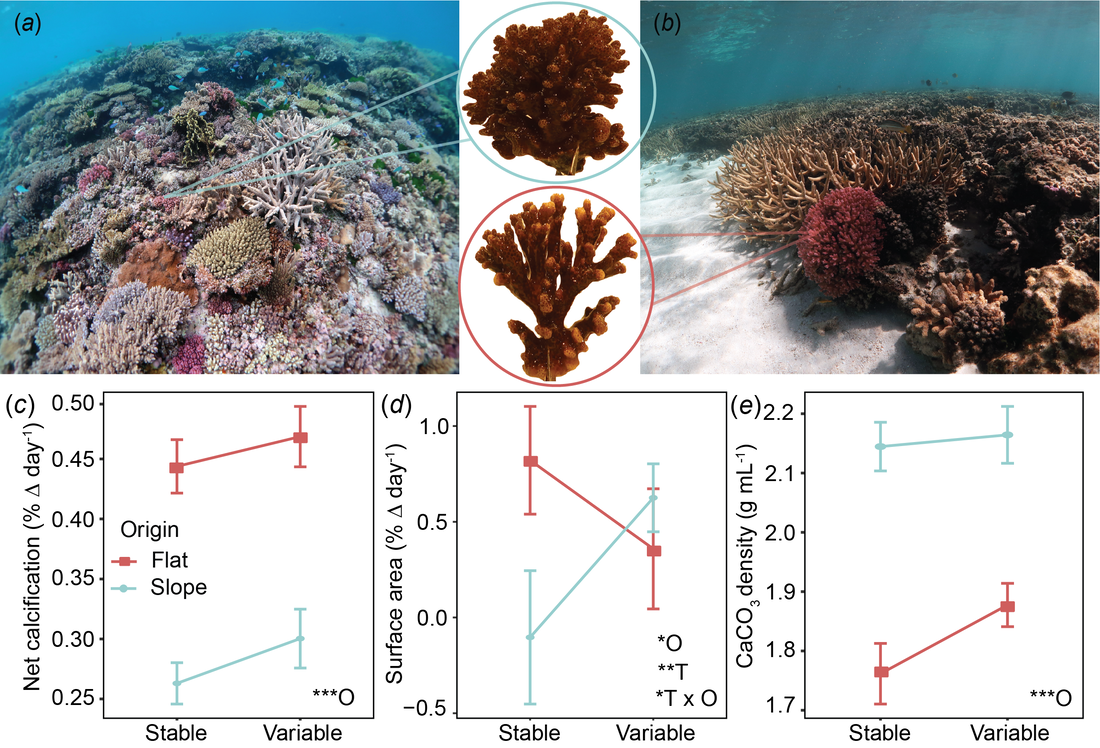
a) Representative images of the reef slope at North Bommie and b) the reef flat at North Beach, Heron Island, southern Great Barrier Reef. Insets show representative Pocillopora damicornis fragments at the end of the two month experiment, demonstrating analogous phenotypic behaviour to the habitat of origin. c) Net calcification rates, d) surface area, and e) calcium carbonate (CaCO3) density by treatment and origin, displayed as means ±SE. Insets indicate statistical significance (*p <0.05, **p < 0.001, ***p < 0.0001) of individual and interactive effects for origin (O) and treatment (T) as determined from linear mixed effects models.
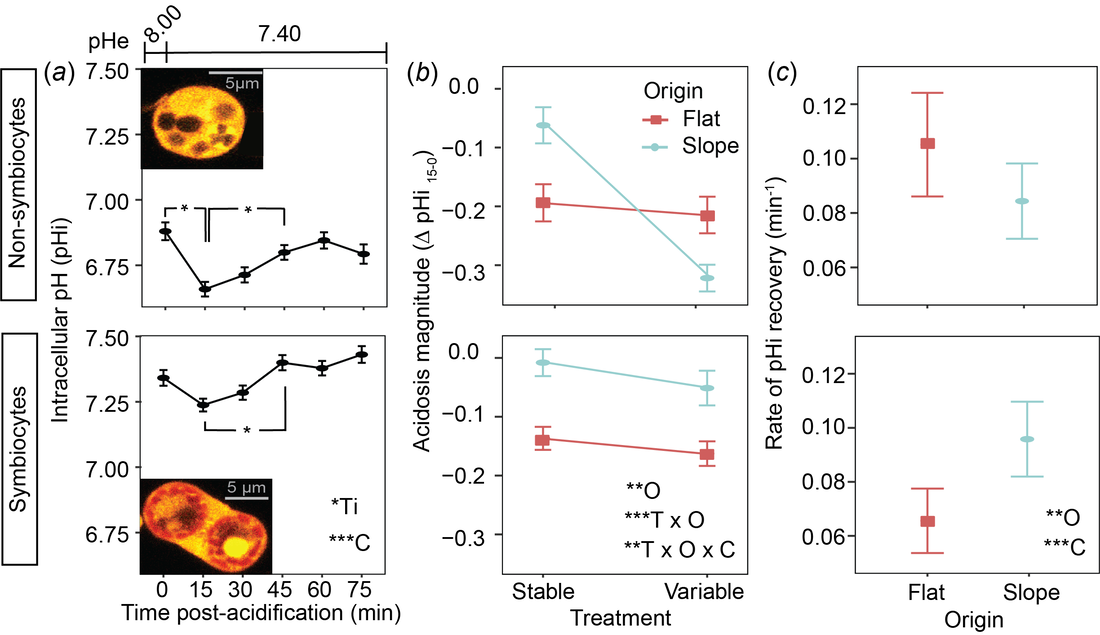
a) Intracellular pH (pHi) of cells from Pocillopora damicornis corals following exposure to acidified seawater (pHe 7.4) for non-symbiocytes (top) and symbiocytes (bottom) over time by cell type. Insets show the fluorescence micrograph of cells lacking microalgal endosymbionts and containing microalgal endosymbionts loaded with SNARF-1 AM (orange; endosymbiont autofluorescence is indicated in red). b) The initial change in pHi in response to acidification stress (acidification magnitude; ΔpHi15-0) by treatment, origin and cell type. c) The rate of pHi recovery (pH min-1) by origin and cell type. Statistical significance (*p < 0.05, **p < 0.001, ***p < 0.0001) is displayed for individual and interactive effects for time (Ti), origin (O), treatment (T), and cell type (C) as determined from linear mixed effects models. All data are displayed as means ±SE.
Divergent recovery trajectories in reef-building corals following a decade of successive marine heatwaves
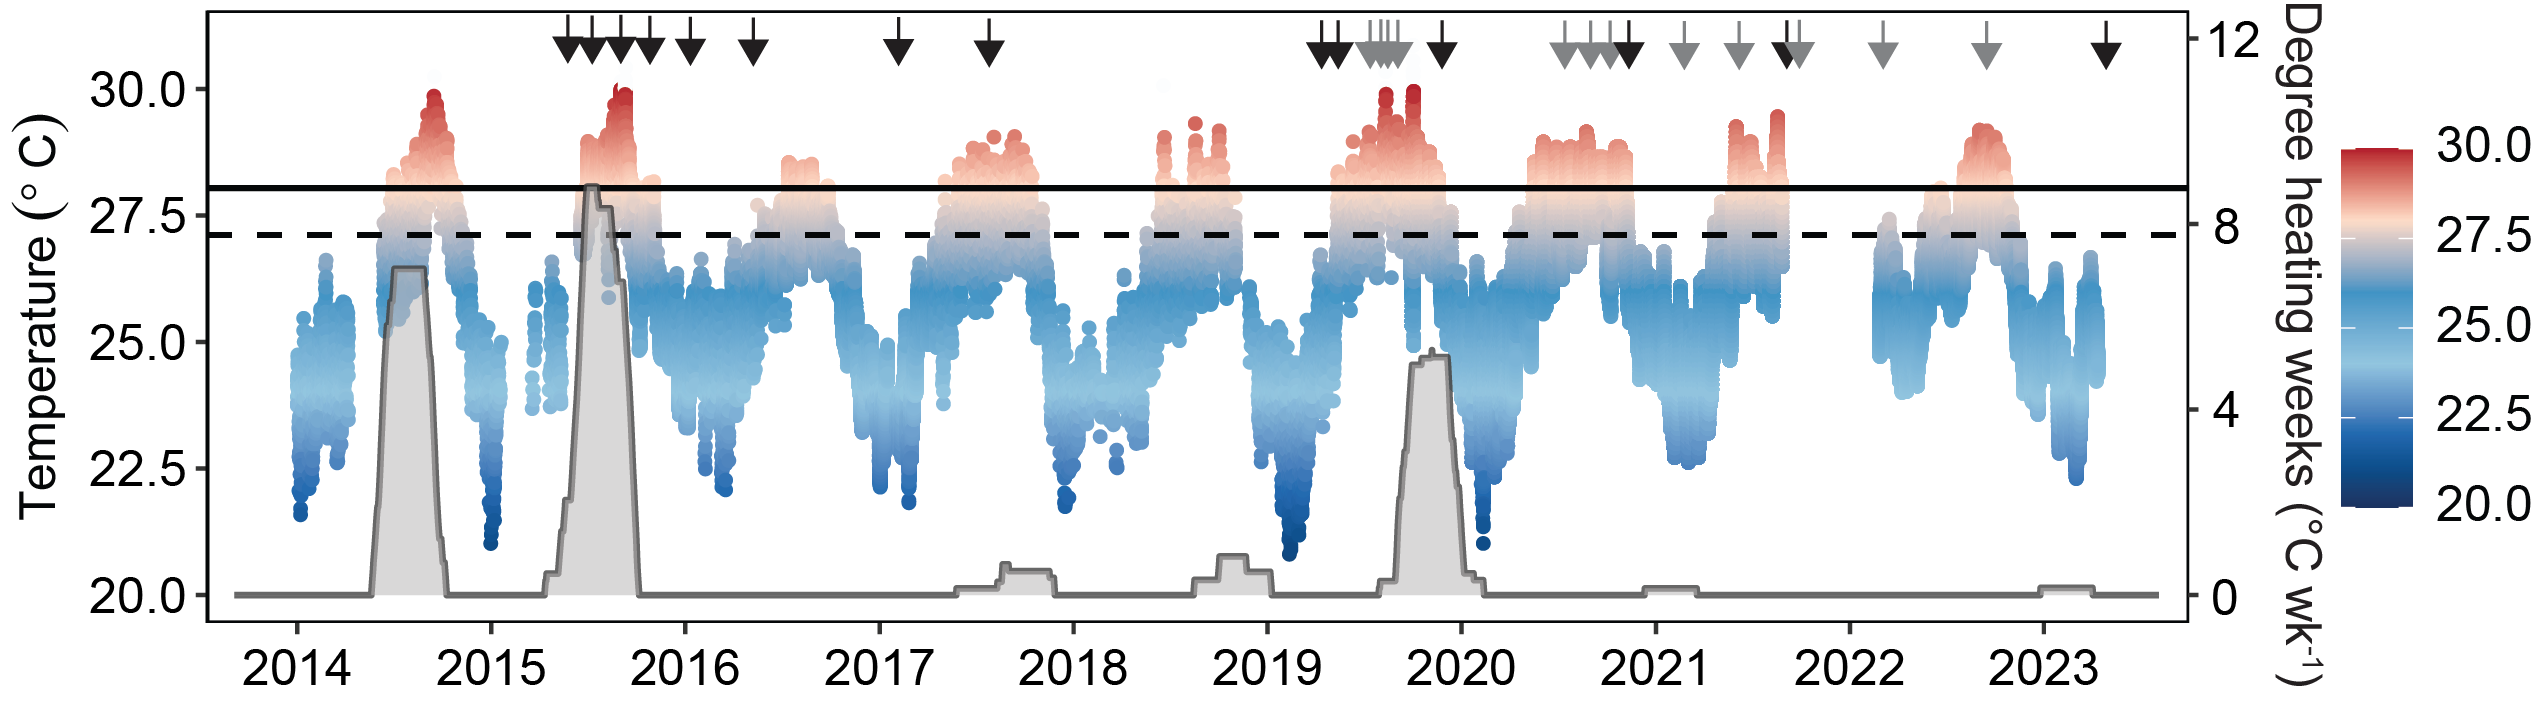
Temperature profile and heat stress accumulation over time. In situ temperatures were recorded from January 2014 – April 2023 at a depth of 0.7 – 2.7 m in Kāne‘ohe Bay. Points indicate hourly measurements (metadata in Table S1). Heat stress accumulation was estimated by degree heating weeks (gray shading) calculated from mean daily (24 hr) temperatures. Black arrows indicate image collection and gray arrows indicate image collection/physiological sampling. Dashed horizontal line indicates the Kāne‘ohe Bay’s climatological maximum monthly mean (MMM; 27.3°C) and solid horizontal line indicates the local coral bleaching threshold (MMM+1°C; 28.3°C).
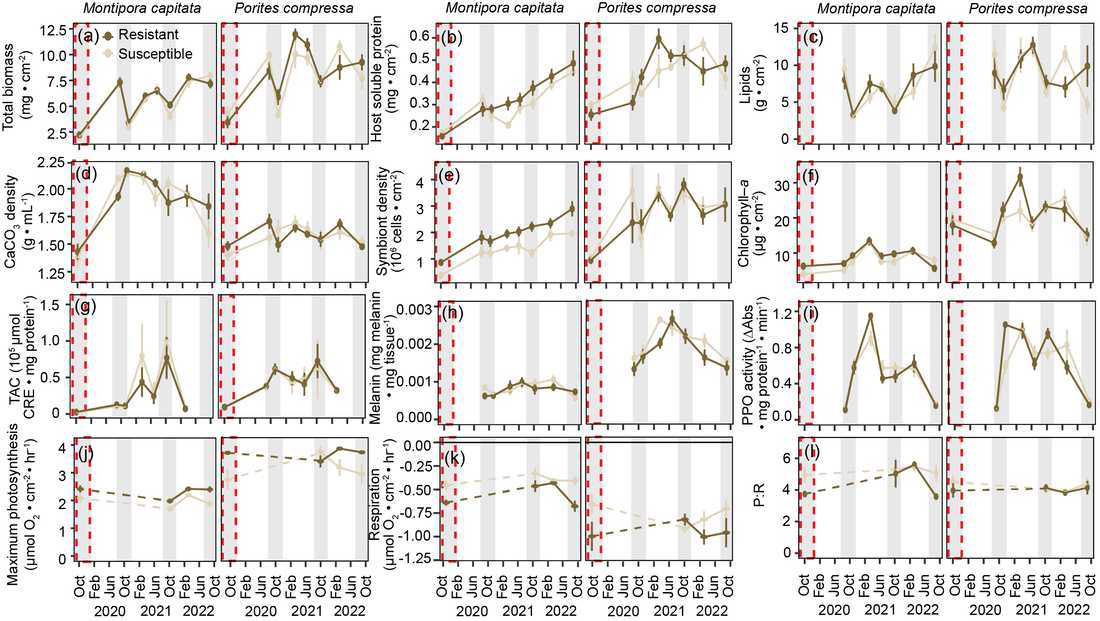
Physiological response of bleaching-resistant and bleaching-susceptible corals over time. (a) Host total tissue biomass (ash-free dry weight), (b) host soluble protein density, (c) host lipid density, (d) calcium carbonate (CaCO3) density, (e) endosymbiont cell density, (f) chlorophyll-a concentration, (g) host total antioxidant capacity (TAC), (h) host melanin content, (i) host prophenoloxidase (PPO) activity, (j) maximum photosynthetic rates, (k) light-enhanced dark respiration rates, and (l) photosynthesis to respiration ratios (P:R) for bleaching-susceptible and bleaching-resistant Monitpora capitata and Porites compressa. Grey shading indicates seasonal peak temperatures (i.e., September–October), with a dashed red rectangle representing the 2019 marine heatwave.
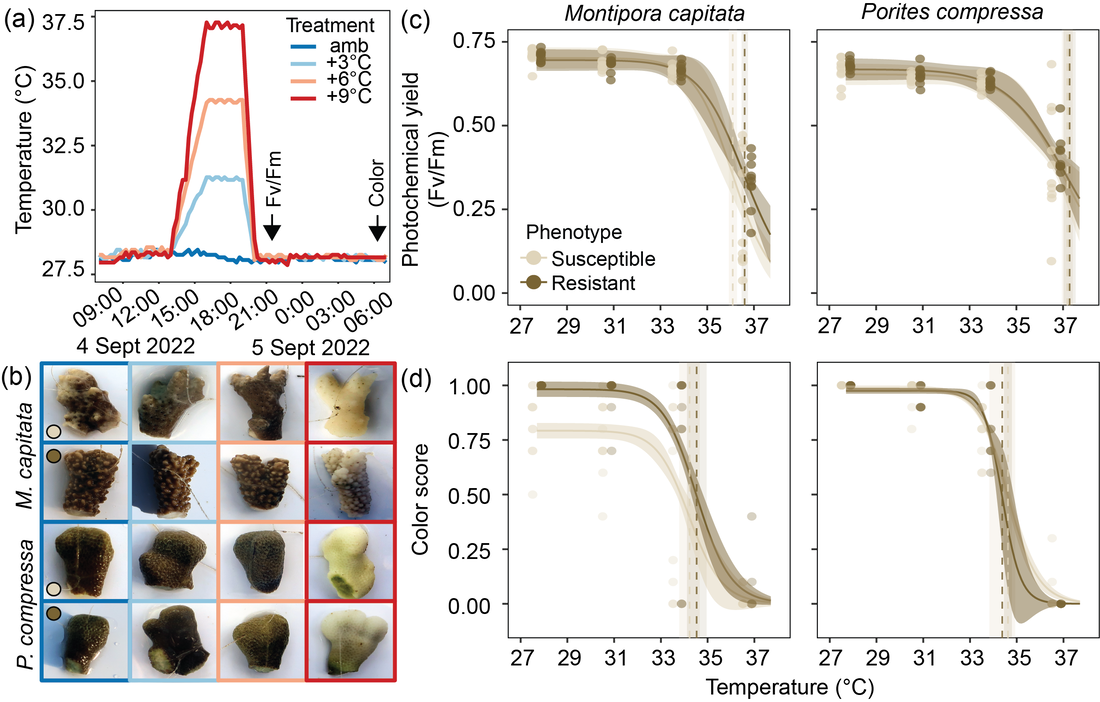
Variation in heat tolerance across bleaching-susceptible and bleaching-resistant corals from experimental heat stress assay. (a) Recorded hourly temperature measurements of the controlled experimental heat stress assays (amb = ambient temperature of 27.7°C), with an arrow indicating when dark-adapted photochemical yield (Fv/Fm) and color score were determined. (b) Respective images of coral fragments during the short-term heat stress. Three-parameter log-logistic dose–response curves were fitted to (c) Fv/Fm measurements (± 95% CI) and (d) color score measurements (± 50% CI) in response to temperature for Montipora capitata and Porites compressa, where points indicate individual measures for coral genets (n = 10) in each treatment. Dashed vertical lines indicate the mean effective dose 50 (ED50) for each phenotype, with the standard error indicated by the shaded regions based on individual curve fits for each coral genet. Photochemical yield ED50s for each coral/phenotype were: 36.1°C M. capitata (susceptible), 36.6°C M. capitata (resistant), 37.2°C P. compressa (susceptible), 37.3°C P. compressa (resistant). Color score ED50s for each coral/phenotype were: 34.2°C M. capitata (susceptible), 34.5°C M. capitata (resistant), 34.6°C P. compressa (susceptible), 34.4°C P. compressa (resistant).
Maximal coral thermal tolerance is found at intermediate diel temperature variability
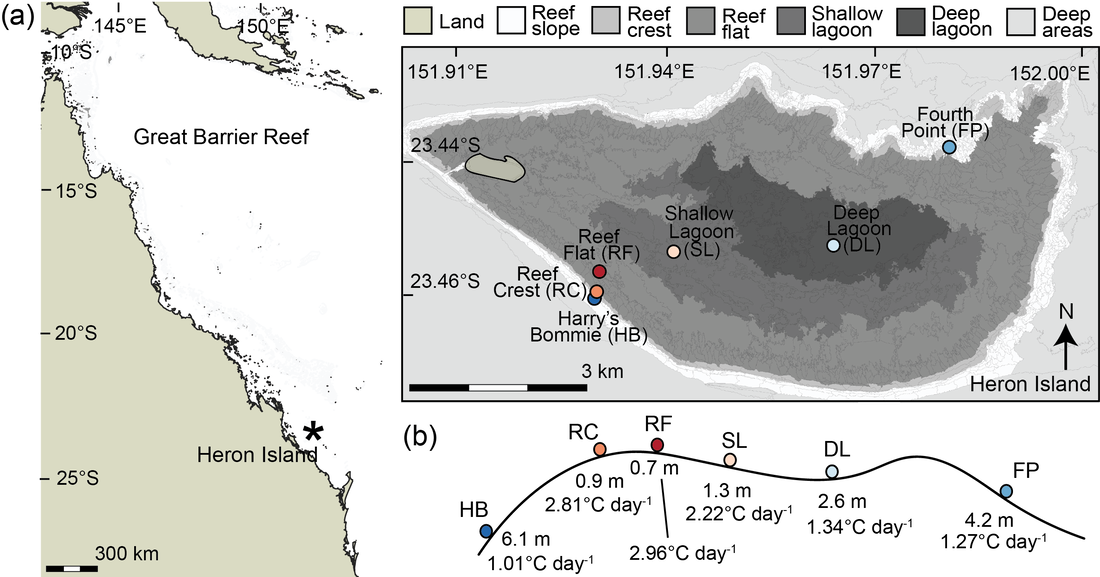
Study location and reef profile of Heron Island, southern Great Barrier Reef. (a) Map of the Great Barrier Reef, with an asterisk showing the location of Heron Island. Map inset details the geomorphological habitats of Heron Reef, redrawn from the data of (Phinn et al., 2012), with sampling sites indicated. (b) Reef profile showing the depth and maximum diel temperature variability across the reef sites investigated in this study.
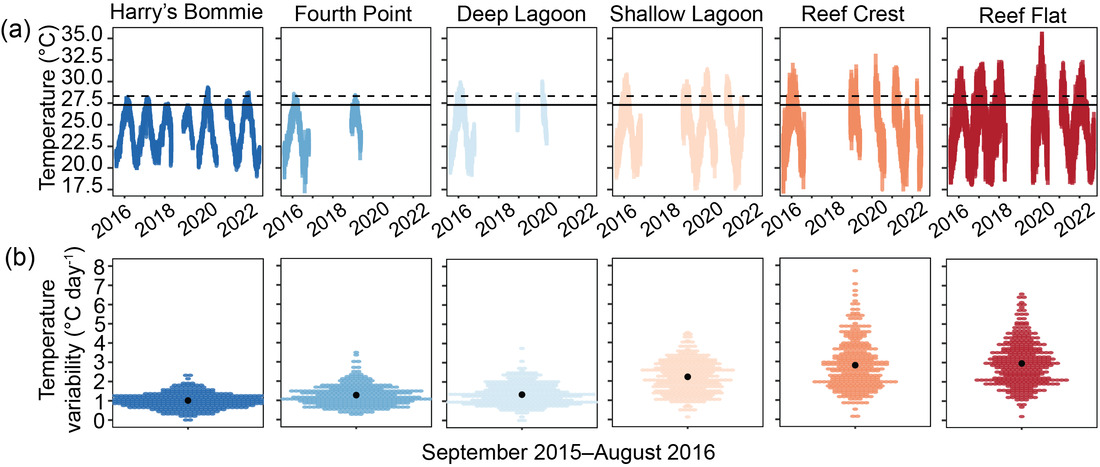
Temperature profiles across Heron Reef from least to most thermally variable. (a) Hourly seawater temperatures were recorded from August 2015 to September 2022. Solid horizontal line indicates the region’s climatological maximum monthly mean (MMM; 27.3°C) and dashed horizontal line indicates the region’s coral bleaching threshold (MMM + 1°C; 28.3°C). (b) Diel temperature variability across September 2015–August 2016, where individual points represent each day and the black point indicates the mean across the year.
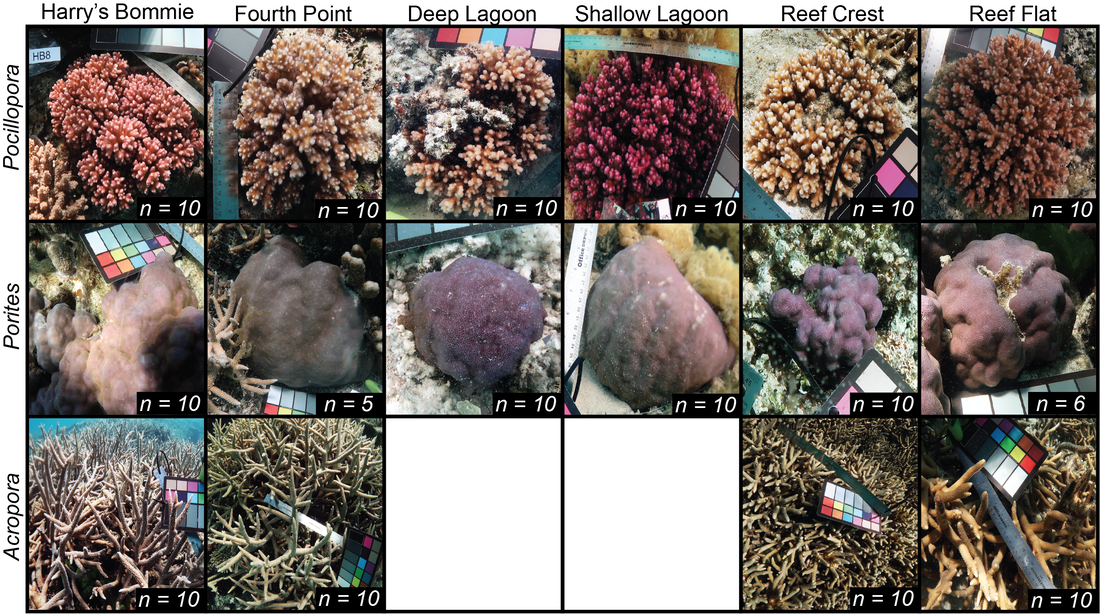
Representative images of coral genera across sites at Heron Island, southern Great Barrier Reef. Inset indicates the number of colonies collected at each site. At the Deep Lagoon and Shallow Lagoon, Acropora was absent or rare so was not evaluated.
Ocean warming and acidification uncouple calcification from calcifier biomass which accelerates coral reef decline
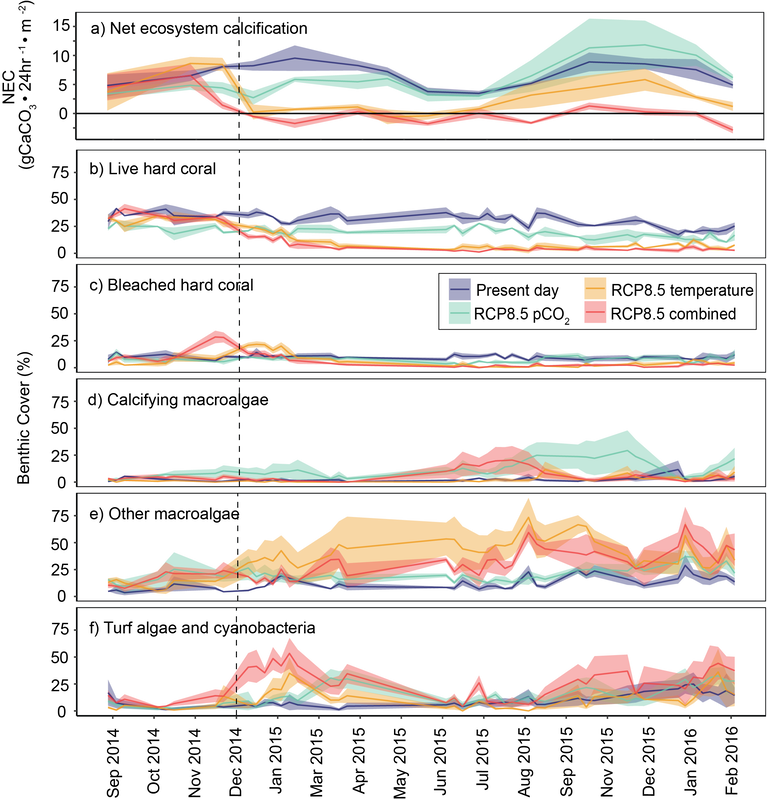
a Integrated 24-h net ecosystem calcification rates indicate strong seasonal variation. Benthic cover was determined from weekly photographs across the 18-month experimental period for: b Live hard coral (Acropora, Montipora, Fungia, Lobophyllia, Porites, Platygyra, Seriatopora, and Stylophora), c Bleached hard coral, d Calcifying macroalgae (crustose coralline algae, Halimeda), e Other macroalgae (i.e., Lobophora, Caulerpa), and f turf algae and cyanobacteria. All lines are means ± standard error. Dashed vertical line indicates the start of sampling period.
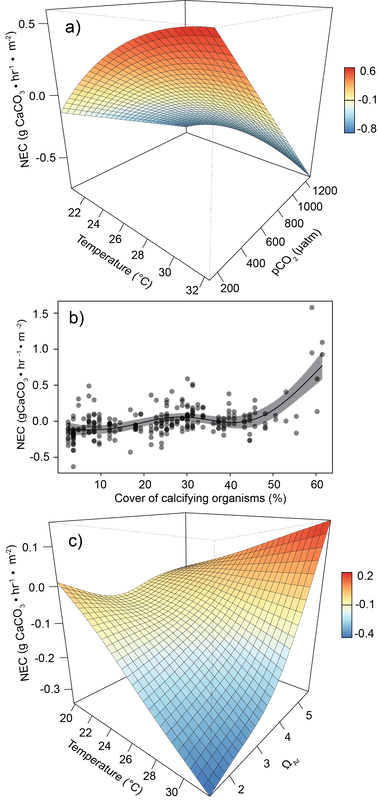
a Three-dimensional graphic output of the significant interaction between temperature and pCO2 as predictors of daytime net ecosystem calcification (NEC) rates. b Relationship between daytime NEC and the cover of calcifying organisms for the best model at mean temperature and pCO2, shaded zone represents 95% confidence interval. c Three-dimensional graphic output of the significant interaction between temperature and aragonite saturation state (ΩAr) as predictors of nighttime NEC rates. Cover of calcifying organisms includes hard coral and calcifying macroalgae.
Fine-scale heterogeneity reveals disproportionate thermal stress and coral mortality in thermally variable reef habitats during a marine heatwave
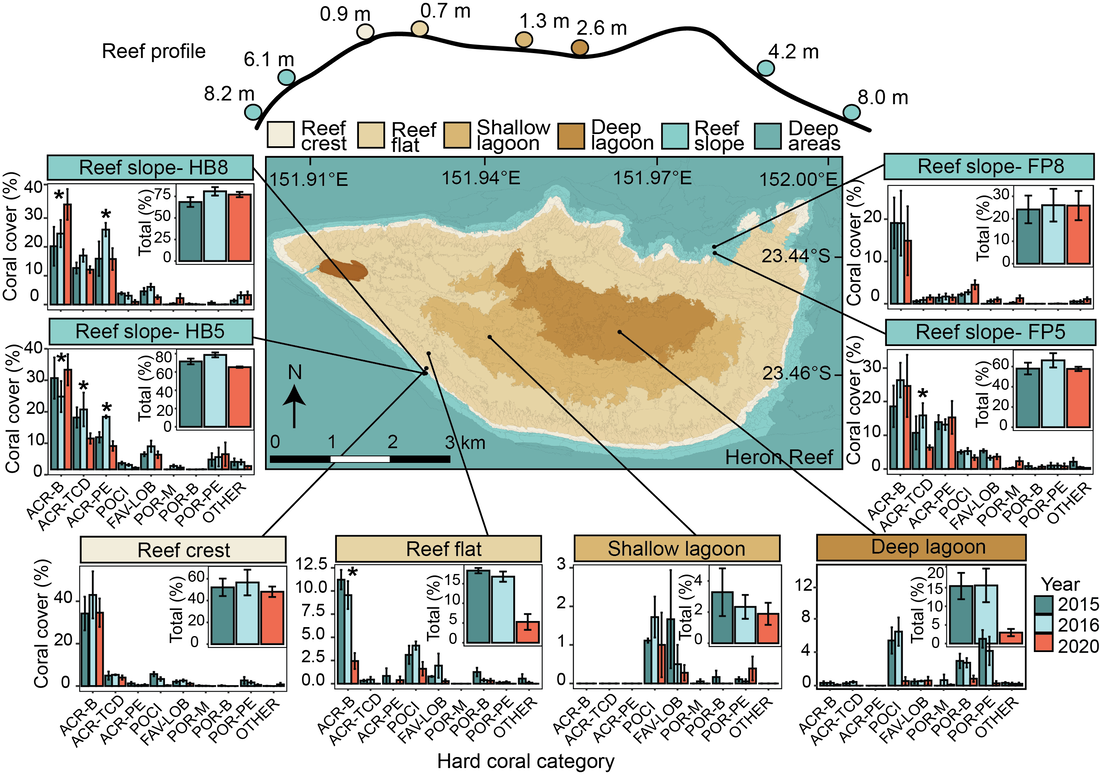
Hard coral abundance by site and year across Heron Reef. Cross section of Heron Reef indicating each site and mean depth (m). Map shading represents geomorphological habitats, redrawn from the data of Phinn et al. 2012. Hard coral cover is displayed by functional group, with inset showing total coral cover (% ± SE; n = 3). Asterisks (*) indicate where there are significant (p < 0.05) differences within categories. ACR-B, Acroporidae- branching; ARC-TCD, Acroporidae- tabular/corymbose/digitate; ACR-PE, Acroporidae- plating/encrusting; POCI, Pocilloporidae; FAV-LOB, Faviidae-Lobophyllidae; POR-M, Poritidae-massive; POR-B, Poritidae-branching; POR-PE, Poritidae-encrusting/plating varieties; and OTHER, other hard corals (including non-scleractinian corals)
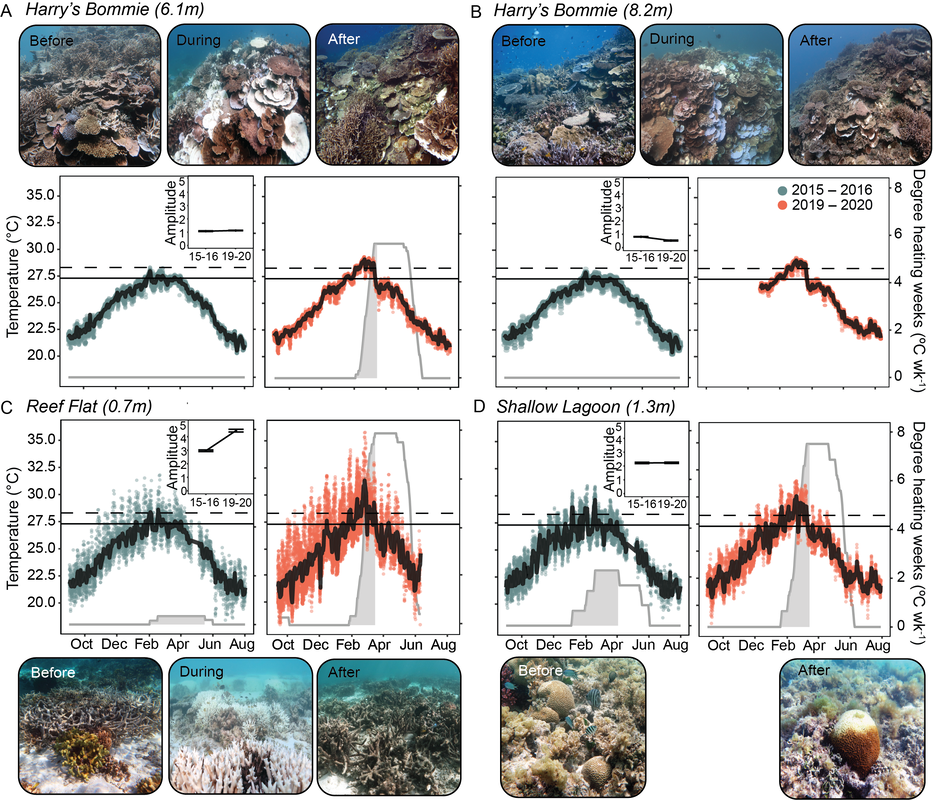
Temperature profiles and representative images from thermally stable and thermally variable habitats across Heron Reef. Images show coral communities before thermal stress (November 2015), during the peak of the marine heatwave (March 2020) and five months after the marine heatwave (August 2020). In situ temperature profiles and heat stress accumulation recorded from September 2015–August 2016 and September 2019–August 2020 at four sites across Heron Reef: (A) Thermally stable reef slope at 5 m depth (Harry’s Bommie 5 m), (B) thermally stable reef slope 8 m depth (Harry’s Bommie 8 m), (C) thermally variable reef flat and (D) thermally variable shallow lagoon. Points indicate hourly measurements and solid black lines indicate mean daily temperatures. Heat stress accumulation (gray shading) was estimated by degree heating weeks (solid gray line) calculated from mean daily temperatures. Degree heating weeks were not calculated for (B) in 2019–2020 due to an incomplete record. Solid horizontal line indicates the region’s climatological maximum monthly mean (MMM; 27.3 °C) and dashed horizontal line indicates the region’s coral bleaching threshold (MMM + 1 °C; 28.3 °C). Insets show mean daily temperature amplitude (°C ± SE). Image credit: Before, After: Kristen Brown; During: Aaron Chai
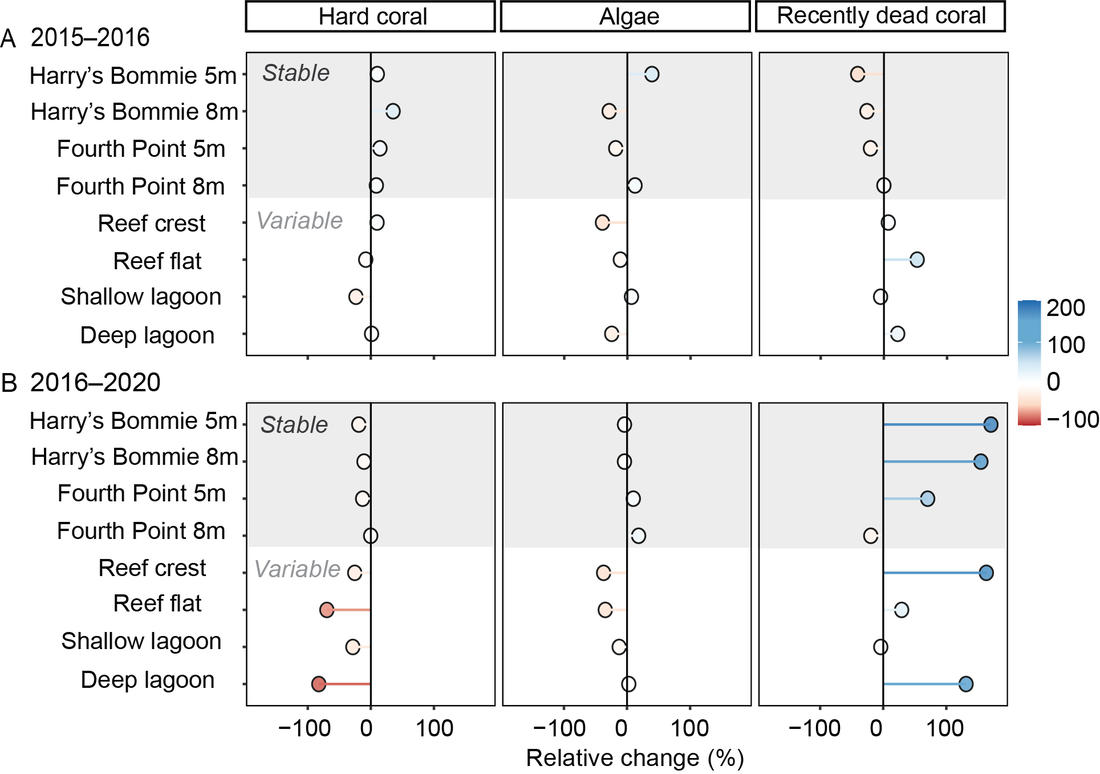
Relative change in benthic cover across thermally stable and variable sites. (A) Relative change (%) in cover between 2015 and 2016. (B) Relative change in cover between 2016 and 2020. Benthic categories are displayed at the top of the Figure: hard coral (includes bleached coral); algae; and recently dead coral (includes coral rubble)
